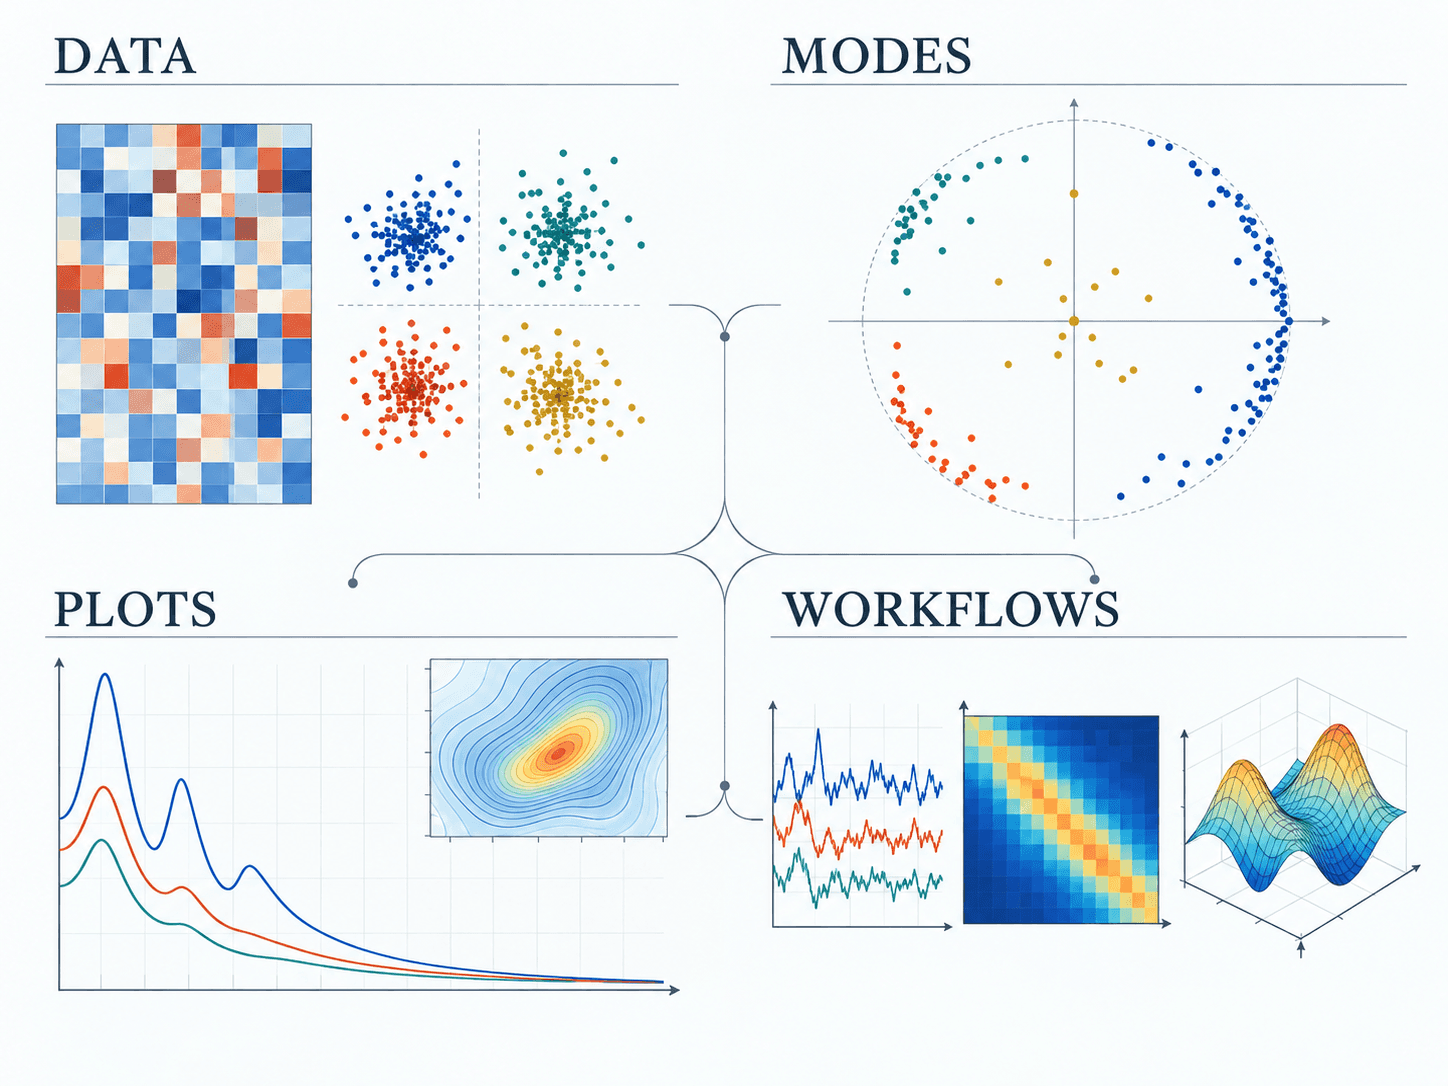
Problem & purpose
Band grouping in eigenmode-analysis organizes results while preserving the original observations. It supports comparison and inspection; geometric grouping alone does not establish a unique physical mode identity.
The problem
Candidates can change order, cross or disappear between samples. Organizing them for comparison should preserve gaps and source observations; a numerical track does not by itself establish a unique physical mode.
Images & examples
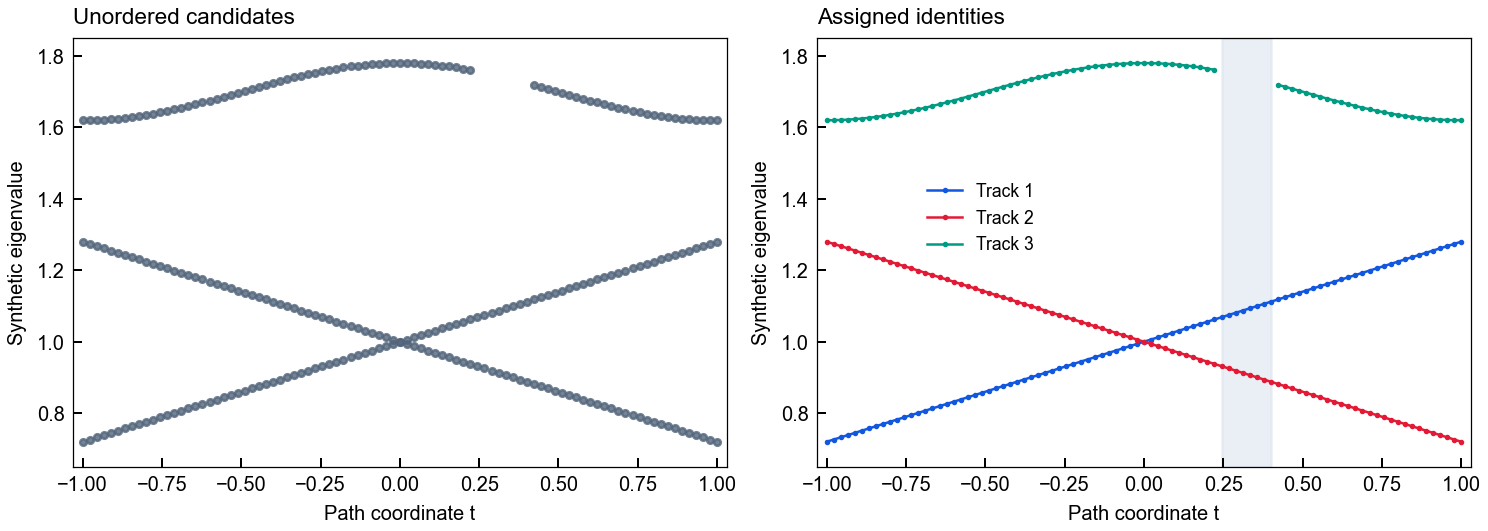
This site's tracking image comes from synthetic_tracking.py in stable version 0.2.10: the same 265 synthetic observations and eight missing slots remain before and after tracking. It demonstrates path tracking, not validation of the advanced grouping algorithm.
eigenmode-analysis / algorithm
Reproduce tracking through a crossing and missing candidates
Use the public synthetic example for eigenmode-analysis 0.2.10: 91 sampling positions, 3 dimensionless branches, shuffled candidate lists and 8 missing slots, totaling 265 observations. The input definitions, commands and output diagnostics can all be checked against pinned source.
Example source ↗ 93e4270de07497e50d7b59243edbfec642d48796Pin the input and source
Check out the public revision below. Seed 1729 shuffles each site's candidates. The three branches are 1 ± 0.28t and 1.7 + 0.08 cos(πt), sampled at 91 points from −1 to 1; the upper branch is absent at indices 56–63. This reproduction used Python 3.11.9; the pinned numerical and plotting dependencies below require Python 3.11 or later.
git clone --branch public-release --single-branch https://github.com/Patr1ck2005/eigenmode-analysis.git
cd eigenmode-analysis
git checkout --detach 93e4270de07497e50d7b59243edbfec642d48796
python -m venv .venv
Install in isolation and run
Activate .venv for your shell, then run the commands below. The two public-source dependencies use the README's pinned install commits, providing the stable 0.2.10 API and plot export. NumPy, SciPy and Matplotlib are pinned to this site's reproduction environment. No simulator, research dataset or server is required.
# Windows PowerShell: .\.venv\Scripts\Activate.ps1
# macOS / Linux: source .venv/bin/activate
python -m pip install "numpy==2.4.6" "scipy==1.17.1" "matplotlib==3.10.9"
python -m pip install "eigenmode-analysis @ git+https://github.com/Patr1ck2005/eigenmode-analysis.git@e172495aa0c561cf0edf251ae9828dd5e54d2d64"
python -m pip install "plot-foundation @ git+https://github.com/Patr1ck2005/plot-foundation.git@c3d3cc23b2bb4da7ade7e5edf553d4a36d19db7f"
python -m pip check
python examples/synthetic_tracking.py --out docs/assets/showcase
Compare the same observations
CandidateSet holds local candidate IDs and values at each site; track_path matches three tracks with derivative_weights = 2. Script assertions check that observations are neither lost nor duplicated, the expected crossing is recovered, and all eight missing slots remain None/NaN. This compares unordered observations with assigned tracks without interpolating replacement data.
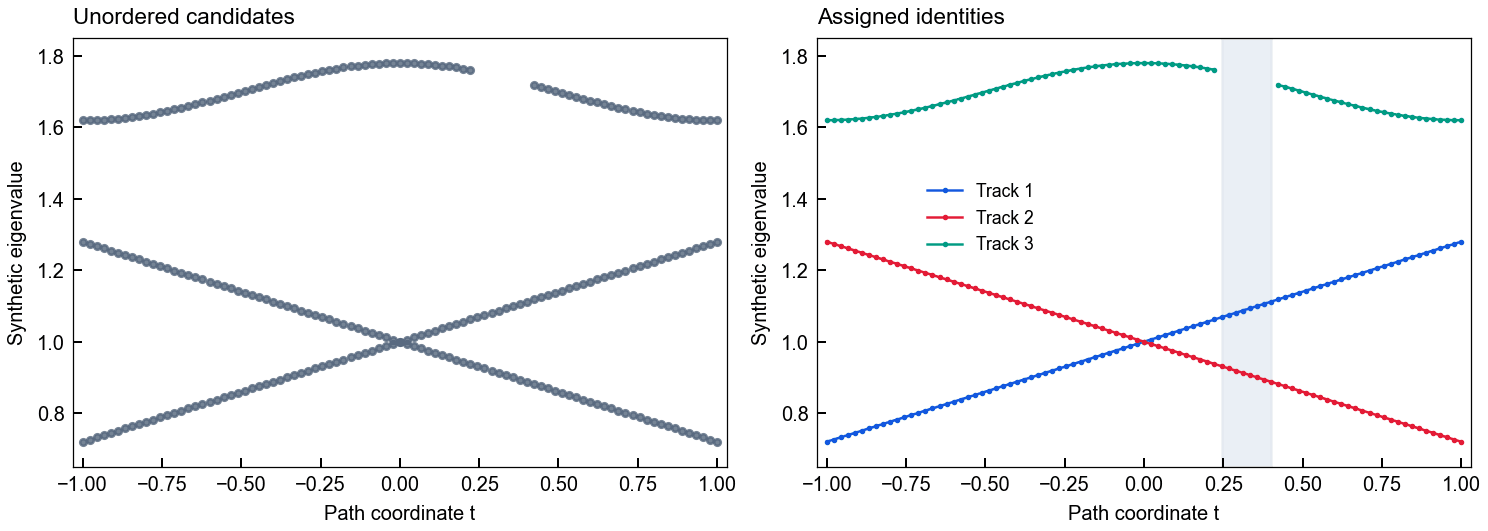
The same 265 observations gain explicit track labels. The upper branch's eight missing slots in the shaded interval remain missing; colors denote numerical tracks. The left panel shows unordered points, not a simple-sorting baseline.Source: eigenmode-analysis 0.2.10 · synthetic_tracking.py ↗ · MIT Inspect costs, coverage and the receipt
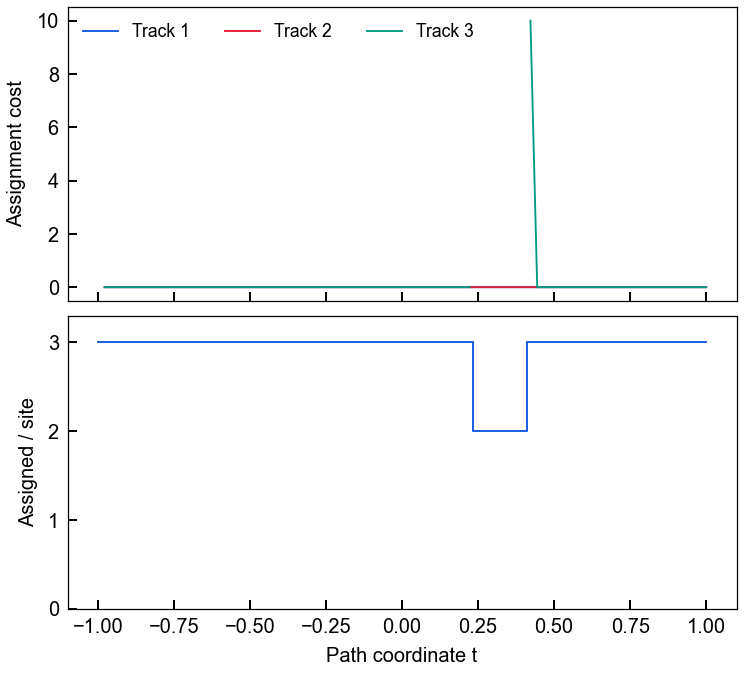
Check per-site counts and matching costs in path-diagnostics.png as well as the curves. manifest.json should report raw_observations = assigned_observations = 265, missing_path_slots = 8 and all_assertions_passed = true. The same script also checks one empty site in a 13 × 9 grid, candidate-order invariance and zero graph conflicts. These checks are narrower than the full package test suite.
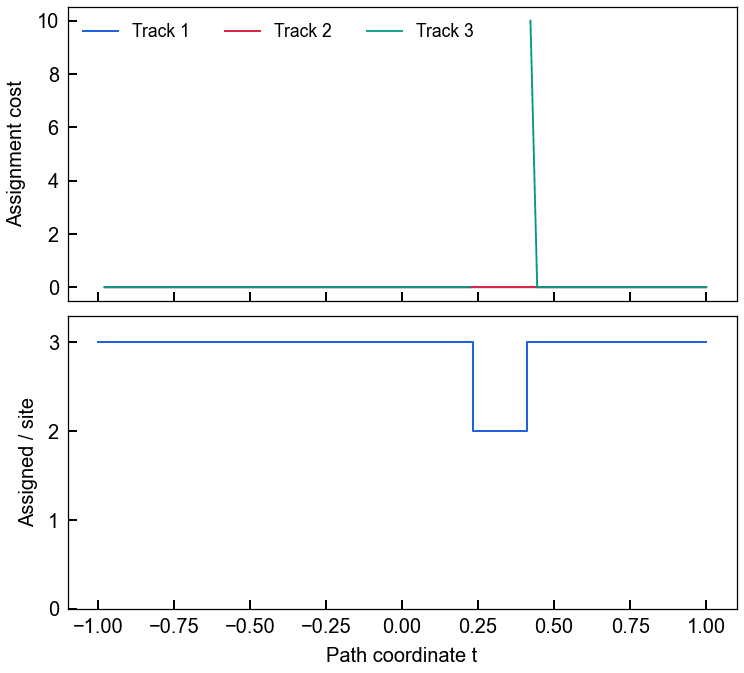
Diagnostics expose the gap: assignments per site fall from 3 to 2, then recover. Matching costs depend on the configuration and are not probabilities of correctness; a cost peak appears near the returning candidate.Source: eigenmode-analysis 0.2.10 · path diagnostics ↗ · MITGenerated from the pinned public source in an isolated environment. The PNG matches the public output at that revision byte for byte, without cropping or restyling.
Expected outputs
- 4 PNG/SVG pairs: hero, crossing-missing, path-diagnostics and graph-diagnostics; plus an offline gallery.html and a manifest.json recording versions, hashes and assertion results.
- The site's isolated reproduction passed; all 4 PNGs matched the public outputs at the pinned revision by hash.
Limits & interpretation
This is an independently defined dimensionless synthetic example, not an experiment, full-wave simulation or data processing for the OEA paper. Numerical tracks do not guarantee unique physical mode identities, and costs are not probabilities. There is no simple-sorting baseline here, nor validation of the separate advanced band_grouping algorithm.
Resources & access
The public repository provides the method, synthetic comparisons and runnable examples. Geometric groups require interpretation in the relevant physical problem.