Problem & purpose
Four shared libraries cover data preparation, mode analysis, plotting foundations and visualization workflows: campaign-data, eigenmode-analysis, plot-foundation and plot-workflows.
The problem
A scan needs coverage and conflict checks before mode analysis and plotting. Four separate libraries connect those steps while leaving data and physical interpretation with the caller.
Images & examples
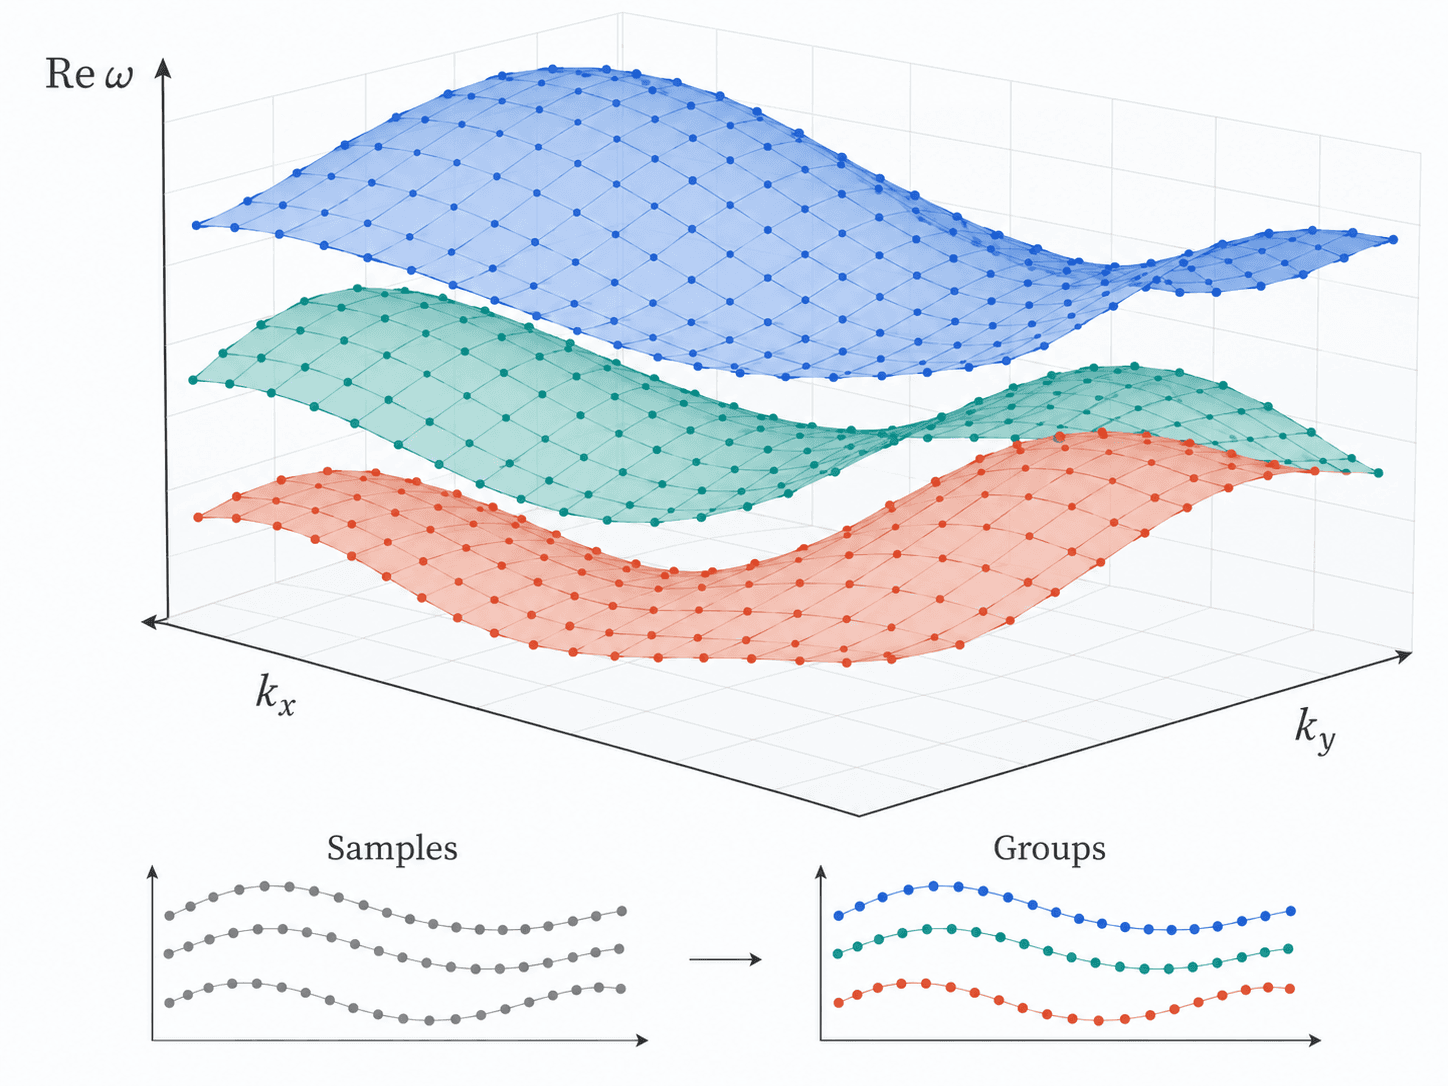
campaign-data audits coverage, overlaps and mesh conflicts in three generated CSVs; plot-foundation renders lines, scalar grids and layered surfaces from analytic functions.
The plot-workflows end-to-end example organizes synthetic candidates into band, Q and polarization views. Its Q and S3 channels are independently defined examples, not physical quantities derived from the eigenvalues.
4 shared libraries
How to start
Start with each repository's installation instructions and synthetic examples: audit files, track candidates, then render and explicitly export. For combined use, follow the compatibility notes in plot-workflows.
Resources & access
Four public repositories provide bilingual documentation and independent synthetic examples. Each repository specifies its installation and compatibility requirements.
- Mode analysisCandidate grouping, path and grid tracking.
- Data preparationFile coverage, duplicate and conflict audits.
- Plotting foundationsReusable scientific plots and explicit exports.
- Combined workflowsFrom synthetic data to band, Q and polarization views.
- Full project directoryPublic optics, scientific computing and interactive software.